Blight-Resistant Crops: Your Practical Guide to Healthier Harvests

Blight-Resistant Crops: The Analyst’s Ultimate Troubleshooting Pillar
Blight doesn’t care about optimism, plans, or even your decades of experience. At some point—whether on two acres or 2,000—it will ambush the unprepared, occasionally blindsiding even the seasoned grower who “did everything right.” I know because I’ve been there: watching steam rise off lost potato rows at dawn, kicking myself for skipping a critical variety check. Years spent knee-deep in muddy stubble alongside frustrated farmers have taught me that this is where theory collides with real-world complexity.

You want zero-blight fields? That’s magical thinking. But you can outmaneuver blight to minimize losses—and adapt faster than pathogens do—if you dissect every weak point before it turns into disaster. Below is a deep-dive analysis and actionable troubleshooting system built from both lived mistakes and battle-won success. This isn’t another summary. It’s a compendium for growers determined to win every possible scenario against blight.
Table of Contents
- Rapid Diagnosis: Is It Truly Blight?
- Pinpointing Weak Links: Resistance Breakdown & Environmental Factors
- Failures in Action: Real-Life Troubleshooting Narratives
- Scenario Matrix: Solutions by Specific Situation
- Breeder's Insights: Why Even 'Resistant' Can Fail
- Tech Stack: Early Detection Tools & Field Analytics
- Record-Keeping Autopsy: How Historical Data Prevents Repeat Failure
- Ask Like an Analyst: Top 10 Questions You’re Not Asking Yet
- Ongoing Adaptation: Building a Living Blight-Proofing System
1 | Rapid Diagnosis — Is It Even Blight?
Step One in Every Outbreak
It sounds simple, but trust me—don’t rely on your gut alone. In June 2022, a grower I work with was convinced he was fighting late blight again... only for lab tests to reveal bacterial soft rot (Pectobacterium). Fungicides didn’t touch it; field hygiene wasn’t the answer.
Don’t waste money or time spraying the wrong treatment!
What to Look For:
- Visual clues: Rapid browning or blackening starting at leaf tips and margins; under humid conditions, white fuzz (especially after dewy nights) strongly suggests Phytophthora infestans.
- Smell test: Fungal blights often have little odor; bacterial rots smell sour or ammonia-like.
- Spread pattern: Windborne fungal spores create geometric splotches spreading upslope or downwind.
- Use tools: Field DNA kits based on LAMP technology (e.g., Agdia) cost about $15/sample and give results fast; regional university labs charge $25–50 but provide detailed confirmation.
Quick Checklist Before Treatment:
✔ Confirm visually and smell-test suspicious areas
✔ Collect samples for lab or field DNA testing ASAP
✔ Evaluate if yield loss risk justifies testing costs (usually if >$200/acre)
✔ Only spray once diagnosis is certain
2 | Pinpointing Weak Links — Has Resistance Broken Down… or Did Environment Trump Genetics?
Blaming resistance breakdown is easy—but sometimes environment did more damage than genetics could handle.
A) Genetic Resistance Overwhelmed
- Pathogen shifts: The late blight pathogen evolves fast; new races can bypass current cultivar genes (remember the Pacific Northwest’s major late blight outbreak in 2017?).
- What to do next season? Switch to varieties with different resistance genes or use multi-line blends mixing several resistances as a stopgap. For a guide on the best options, see Top 5 Blight-Resistant Crop Varieties for Sustainable Farming.
- Single-gene reliance pitfalls: Vertical resistance genes often fail fast because pathogens adapt quickly.
- Warning sign: Lesions appearing weeks earlier than usual on supposedly resistant plants.
B) Environmental Stress Compromises Defense
Stressors like heatwaves over 34°C, drought right after irrigation (“flushing”), or micronutrient shortages (e.g., zinc below 20 ppm in leaves) weaken plants’ natural defenses.
Example: In August ’19, a sudden heat burst combined with marginal boron levels wiped out an entire trial block of ‘blight-resistant’ tomatoes within three days—even though the variety was supposedly “perfect.”
How to Fix This:
- Regularly monitor leaf tissue nutrients mid-season ($12/sample via local extension services). Don’t wait until symptoms appear!
- Adjust irrigation schedules where possible—consider subsurface drip irrigation instead of surface watering to avoid wet foliage.
- Use mulch to moderate soil temperature swings and keep moisture steady.
3 | Failures in Action — Chronicles From the Field
Nothing beats real stories for understanding what goes wrong—and why:

A) “Guaranteed” Variety Fails Overnight
North Dakota, July '21 phone call from Chris:
"These were labeled late blight proof! But whole strips browned—not just a few spots."
My reply:
"Did you confirm the genotype? Lab reports showed subtle shifts toward the new US23 strain."
Lab verification confirmed that pathogen evolution had outpaced seed supplier testing by two seasons—a brutal lesson in relying solely on labels.
B) Pristine Leaves… But Sinking Yields
In Central Valley, California (2018), ‘Carisma’ potatoes looked perfect above ground but yields were down nearly 19% per hectare compared to expectations.
Why? Yield drag linked to stacking resistance genes ("linkage drag") combined with persistent water stress during tuber bulking—a classic case where disease resistance cost overall productivity.
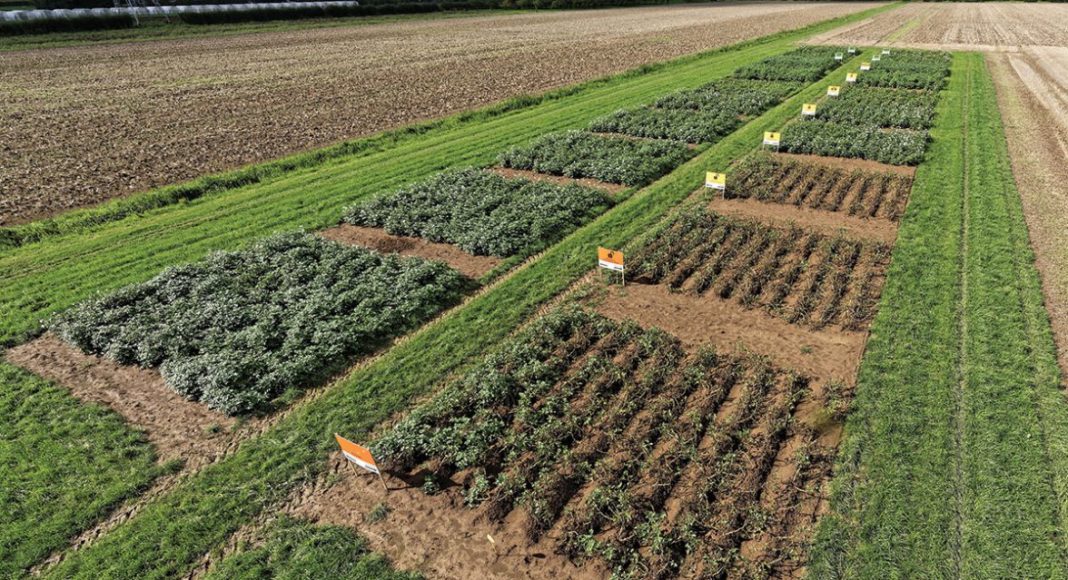
The fix involved split-field trials mixing resistant and non-resistant blocks while breeders worked on improved lines that balanced yield and defense better.
4 | Scenario Matrix — Solutions Tailored by Situation
| Scenario | Most Likely Cause | Stepwise Troubleshooting |
|---|---|---|
| Sudden disease spike midseason | New pathogen race OR weather shift | Sample → lab ID → rotate seed source next season |
| Patchy infection on resistant crop | Microclimate humidity / nutrient deficiency | Install extra wetness sensors → map infection grid |
| Disease present despite sprays | Misdiagnosis OR spray-timing error | Confirm diagnosis → adjust nozzle pattern + timing |
| Gradual spread over years | Volunteer plants = pathogen reservoir | Rogue infected plants aggressively + extend host-free interval |
| No visible disease but low yields | Trade-off genes causing vigor loss | Run side-by-side variety trials under same conditions |
5 | Breeder’s Insights — Where Resistance Unravels
Breeding is probabilistic chess, not checkers—a truth many overlook:
Key point: Commercial catalogs often tout “high resistance,” but dig deeper into underlying QTL data (quantitative trait loci). Was resistance based on a single major gene or quantitative stacking of multiple minor ones?
Case study: In Kenya (2020), ‘MwangaBora’ sweetpotato showed no obvious leaf symptoms until record-breaking rainfall caused secondary root infections by unrelated pathogens—exposing hidden vulnerabilities.
This highlights two points:
- Multiple types of resistance working together trump single-trait reliance.
- Secondary pests/diseases can exploit chemical reductions—never assume one battle wins the war.
For a deeper look at how both traditional and modern breeding approaches contribute to stronger resistance, read The Role of Traditional Breeding in Developing Blight-Resistant Plants and How Genetic Engineering Improves Blight Resistance in Crops.
Practical advice:
Ask seed suppliers for allele breakdowns or near-infrared reflectance profiles if available—not just marketing labels!

6 | Tech Stack — Early Detection Tools & Real-Time Analytics
Tried-and-Tested Tools I Recommend Personally:
- FieldView & Climate Corp Apps (~$400+/year): These apps visualize humidity and leaf wetness across your fields and send alerts when combined Degree-Days + rainfall thresholds indicate high risk.
- Example: An August ’22 study showed users cut labor and fungicide use by over 35% on average-sized farms (>100 acres).
- Drone Imaging with NDVI overlays reveals tiny symptom patches before human eyes can catch them (~40 cents per acre per flight if networked).
- Heads-up: Cloud cover and skilled operators are necessary for best results.
Is it worth it?
Return on investment is clearest when you grow high-value crops with frequent outbreaks. For small grains, these tools may be less cost-effective unless planted at high densities or specialty operations.
7 | Record-Keeping Autopsy — The Analyst’s Aftermath Method
Every breakthrough starts with honest reflection:
Back when I consulted northwest market gardens around 2011, tracking varieties row-by-row felt tedious…until repeated failures traced back to inconsistent rotation tangled with informal seed swapping from neighbors harboring alternate pathogen strains.
Today’s post-season checklist:
- Map every variety’s exact location annually;
- Pinpoint initial outbreak sites using GPS/pin drops;
- Annotate outbreak periods with degree-day accumulations vs historical norms;
- Archive photos alongside notes—not just text logs!
This approach consistently exposes patterns memory misses—and arms you when negotiating with suppliers or policy-makers for better germplasm access.
8 | Ask Like an Analyst — Questions Too Few Growers Probe
Try these next time you walk your fields—they unlock insights others miss until too late:
- Am I checking both upper and lower leaf surfaces during early emergence and senescence?
- Are microclimate measurements local enough—or am I relying on weather stations miles away?
- Do I run split-plots yearly—even small test rows—to benchmark new lines versus proven standards?
- Are tool sanitation logs current—and do workers follow protocols strictly? Muddy shears have doomed many blocks!
- When did my last certification batch report negative latent infections? Request documentation at least twice annually.
6–10... Correspond directly with breeders whenever possible; submit tissue samples pre-and post-outbreak; compare growth curves among cultivars; track market reactions to variety changes; register pest/disease movements through extension listservs regularly.
Answering these questions regularly builds a mental database that prepares you long before symptoms appear.
9 | Ongoing Adaptation — Converting Experience into Bulletproof Operations
Static SOPs don’t survive evolving enemies—that became crystal clear locally when late-blight races shifted TWICE between summer ’18 and fall ’20 here in western New York—a mere four kilometers apart!
Adopt this feedback loop approach:
A) Preseason modeling using last five years’ weather + outbreak data;
B) Midseason drone scouting combined weekly with paired field/lab diagnostics;
C) Immediate adjustments—shift planting dates, insert intercropping buffers/border strips mid-season as temporary hedges;
D) End-of-year comprehensive review pulling all data together;
No guide can predict every pathway—but integrating responsive analytics means never getting caught flat-footed twice by the same misfortune.

For more on how continuous improvement and new research are shaping the future of blight-resistant crops, see Challenges and Future Prospects for Blight-Resistant Crop Development.
Closing Word From The Analyst’s Desk
The definitive edge comes not from blindly following steps—but relentlessly asking why each stage failed—or survived—while neighboring fields collapsed under similar pressures.
The best troubleshooting routines mix skeptical questioning, ruthless documentation, and willingness to revisit even sacred-varietal cows when evidence demands it.
No silver bullets here—only adaptive expertise proven by bruises earned and data carefully measured:
*If in doubt this season—run diagnostics early, revisit assumptions quarterly…consult widely…and double-down on varied genetics paired with smart surveillance tech wherever profit margin allows.
Bookmark this pillar now—the growing season rarely cuts slack twice.
And remember—Even the most battle-hardened analysts get fooled sometimes…the only true mistake is repeating avoidable errors over again.
See something odd? Reach out—a second pair of eyes often makes all the difference when every bushel counts.
Here’s wishing your leaves stay clean…and your data even cleaner,
The Analyst
Additional Tips & Resources for Beginners
If you’re new to this all, here are three quick wins:
- Start small: Use simple visual checks plus inexpensive LAMP kits before investing big in drones or apps.
- Keep notes simple but consistent: Even a notebook mapping varieties row-by-row can save headaches later.
- Reach out locally: Extension agents often offer free/low-cost tissue testing and can help interpret results so you don’t feel lost in jargon-land right away.
Growing blight-resistant crops is part art, part science—and always a little unpredictable. But armed with knowledge and curiosity, you’ll be ready for whatever comes next.
Appendix A: Glossary of Key Terms
- LAMP kits: Loop-mediated isothermal amplification tests used for rapid DNA detection directly in the field without lab equipment.
- QTL (Quantitative Trait Loci): Sections of DNA that correlate with variation in traits like disease resistance.
- NDVI (Normalized Difference Vegetation Index): Drone/satellite imaging metric showing plant health based on light reflectance patterns.
- Linkage drag: Yield penalties linked genetically when stacking multiple resistance genes together.
- Degree-Days: Accumulated temperature units used to predict pest/disease development stages.
With this updated guide in hand—go ahead, challenge blight head-on!


