Bloom Tracking: Your Guide to Growing Success with Every Step
Standing in the predawn quiet, kneeling among damp mulch with soil still cool from the night, I remember jotting my first bloom note in a battered Moleskine. That was 2014, and I’d just lost half a spring crop to an unexpected cold snap. My frustration lingered longer than the chill, so I decided to start logging what happened—and when.

That single change transformed my gardening (and later, my approach to every project since). Here’s what years of bloom tracking—through mistakes, milestones, and some outright disasters—have taught me. These are the hard-won strategies you won’t find on most blogs.
Why Nearly Every Season Starts with False Memories
Memory is a beautiful liar in the garden. Each year I’d swear “the irises always open before the peonies,” only to find photos from prior seasons contradicting me. This isn’t just about nostalgia; it’s about missed cues for fertilizer or pest control windows. Tracking blooms gives you a data-backed calendar unique to your microclimate—not generic advice from seed packets written for somewhere else.
The System That Actually Works When Life Gets Busy
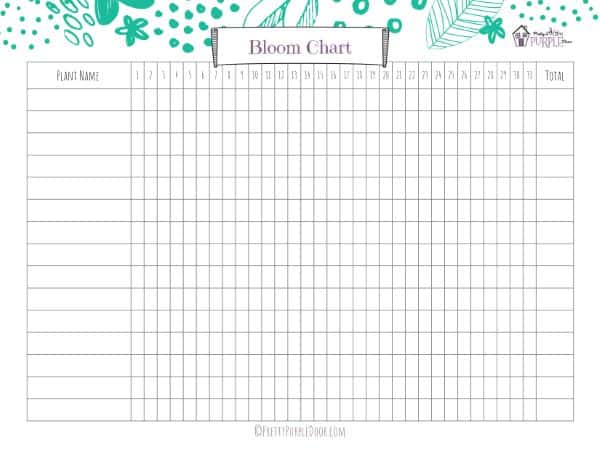
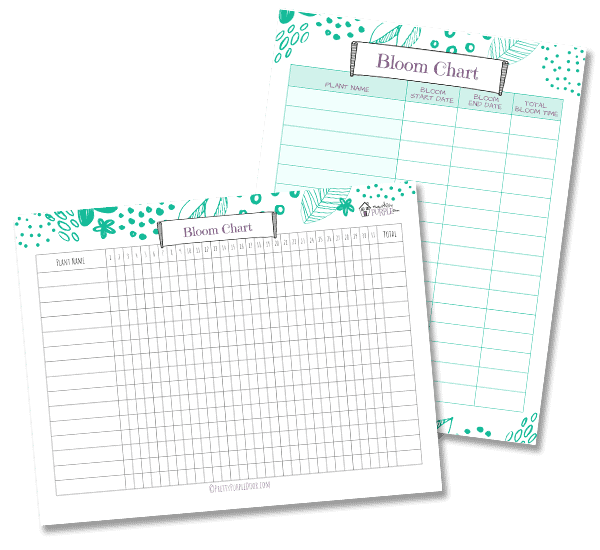
Forget daily logs—that’s the fastest route to burnout unless you’re running a research station. What actually sticks? My “Three-Point Sweep”:
- First Signs: Note the date and weather when buds first appear (don’t wait for full blooms).
- Peak Display: Mark when a plant hits its showiest moment—this is often when pests attack or pollinators arrive.
- Aftermath: Log any unexpected changes: sudden wilt, weird spots, or even animal visitors.
These three points catch almost all actionable signals without overwhelming you—or requiring an app subscription (though more on those below).
My Shortlist of Tools After Testing Dozens
I’ve watched gardeners get paralyzed by options: hand-drawn charts vs. apps vs. spreadsheets. Here’s where years in the trenches count:
- Analog Loyalists: Rite in the Rain pocket notebooks survive hose sprays and muddy hands better than anything else.
- Data Nerds: Google Sheets with conditional formatting will auto-highlight oddball dates—my secret weapon for spotting outliers.
- Photo Trackers: Gardenize lets me tag images by date/location; invaluable when comparing varieties over multiple years.
The tool matters less than making it utterly frictionless—if it takes more than 60 seconds per entry, you won’t keep up once summer chaos hits.
Counterintuitive Truth: Sparse Data Beats Rigid Schedules
Here’s a twist most guides skip: incomplete logs are not failures—they’re signals! One year I was religious about weekly notes… until travel intervened for three weeks smack in peak bloom time. The resulting gaps made it blindingly obvious which perennials thrived on neglect (hello, Russian sage), versus those that sulked without constant attention (looking at you, dahlias).
The lesson? Gaps show true resilience patterns—you don’t need perfection for valuable insights.
Sensory Clues You Should Write Down (But Probably Don’t)
Numbers are great—but don’t ignore what your senses tell you:
- The way tomatoes smell earthy-sweet as they flower signals optimal feeding times.
- A metallic tang in morning dew? Sometimes corresponded with fungal outbreaks after high humidity spells.
- Birdsong volume spikes during peak pollen shed—a natural reminder that bees will be busy (meaning it’s time to hold off spraying anything harmful).
If something catches your eye—or nose or ears—it probably means something worth tracking.
Failed First Attempts: My Spreadsheet Disaster
Confession: My initial spreadsheet was so detailed (soil pH readings! Sun hours per square foot!) that it collapsed under its own weight within weeks. Nothing got logged after May that year.
Lesson learned: Start lean, then add columns only as needed when specific questions arise (“Why did lilies flop this July?” led me to add ‘rainfall total’ as a new field). Let your real problems drive what info you collect—not some ideal template.
Insider Cost Breakdown
If you’re curious about investment:
- Rite in the Rain notebook: ~$12/year
- Basic digital photo storage: Free with Google Photos
- Advanced apps like Gardenize Premium: ~$25/year
Compare this to losing just one $40 peony because you missed an aphid outbreak—the payoff is clear.
Review Rituals That Generate Real Breakthroughs
Every October, I line up my notes across three years and ask:
- Are bloom dates creeping earlier? (Last year: lilacs bloomed five days sooner than their decade average—a tipoff about local warming.)
- Did yield increase after last season’s new mulch experiment?
- Which plants repeatedly fizzled despite best efforts?
Seeing these patterns makes next year’s plan nearly self-writing—and keeps expensive repeat mistakes off my ledger.
Beyond Plants—How This Translates Elsewhere
I’ve used adapted bloom tracking systems for everything from monitoring team creativity spikes (“Aha moments” logged per sprint) to managing annual grant cycles (“first sign of reviewer feedback = bud stage”). The process works because breakthrough timing rarely matches expectations—tracking reveals your actual success cycle rather than what textbooks predict.
Final Word From Experience
Stop aiming for perfect records; start capturing useful ones—even if they’re messy or incomplete at first. The real magic is watching trends emerge where before there was only memory fog and guesswork.
So grab whatever tool feels least intimidating today—even if it’s just sticky notes stuck inside your greenhouse door—and log one detail this week that feels meaningful or surprising. In six months, thank yourself when those early hunches turn into evidence-backed strategy instead of regretful hindsight.
What overlooked detail will make it into your first log?