Mapping Life: How GIS Brings Biodiversity Data to Vivid Life
The Ultimate Troubleshooting Guide: GIS for Biodiversity Data—Every Scenario, Every Solution
Ever had that moment when your carefully loaded biodiversity map looks more like abstract art than meaningful data? Or spent hours running a habitat suitability model only to see outputs that scream “nonsense”? Welcome to the very real, sometimes messy world of applying GIS to biodiversity science. I’ve been in your shoes—wrestling with corrupted shapefiles at 2am, coaxing reluctant datasets to align, and answering questions like “Why are all my bird sightings floating off the West African coast?”
Let’s pull back the curtain on what it actually takes to visualize and analyze biodiversity data in GIS—the stumbles, the unexpected wins, and (most importantly) a troubleshooting playbook so comprehensive you’ll wish you had it years ago.
Table of Contents
- The Real Reasons GIS is Indispensable for Biodiversity
- Before You Hit ‘Import’: The Unskippable Checklist
- Troubleshooting Data Headaches: From Nonsense Maps to Vanishing Points
- Workflow Woes: Diagnosing Analysis Failures and Software Meltdowns
- Making Sense of Models Gone Wrong (Because They Will—Trust Me)
- Visualization Nightmares & Communication Hurdles
- Integrating Crowdsourced Data Without Losing Your Mind
- Future-Proofing: Common Pitfalls in Ongoing Projects
- Rapid Rescue Kit: Tools and Tricks for Crises Big or Small
- Real-World War Stories (What Actually Worked—and Blew Up—in Practice)
- Your Next Steps: Bulletproofing Your Own Workflow
1. The Real Reasons GIS is Indispensable for Biodiversity
Let me say this plainly: maps aren’t just pretty pictures—they’re investigative tools that change how we understand life on Earth.
But don’t take my word for it; consider this real exchange:
Ecologist: “We think species X is isolated by farmland.”
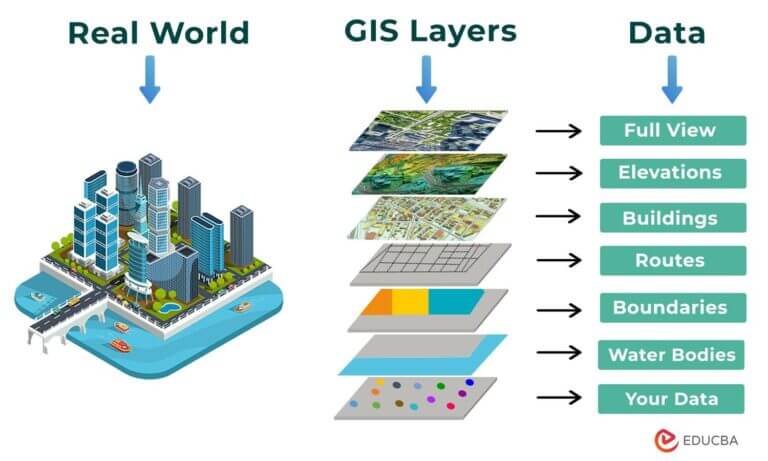
GIS Analyst: “Let’s overlay movement data with landcover changes since 2000.”
Fifteen minutes later—a network of unexpected corridors lights up on screen, rewriting years of assumptions.
This isn’t theory; it’s the daily power of layering data spatially—spotting migration bottlenecks, visualizing range contractions after fires, or testing if new reserves actually cover breeding sites. If you want to dive deeper into how GIS mapping transforms our ability to predict where species can thrive, don’t miss How GIS Mapping Enhances Species Distribution Modeling.
But… none of this magic happens unless your data behaves—and software plays nice.
2. Before You Hit ‘Import’: The Unskippable Checklist
Experience has taught me: Most fatal errors start before you even load a dataset.
Pre-Flight Data Checks
- Are all coordinates using the same projection? (Spoiler: they almost never are out-of-the-box)
- Did you sanity-check field names? (
Species,species_name,SPC—I’ve seen them all mixed even within one file) - Is there metadata explaining sampling methods/timeframes?
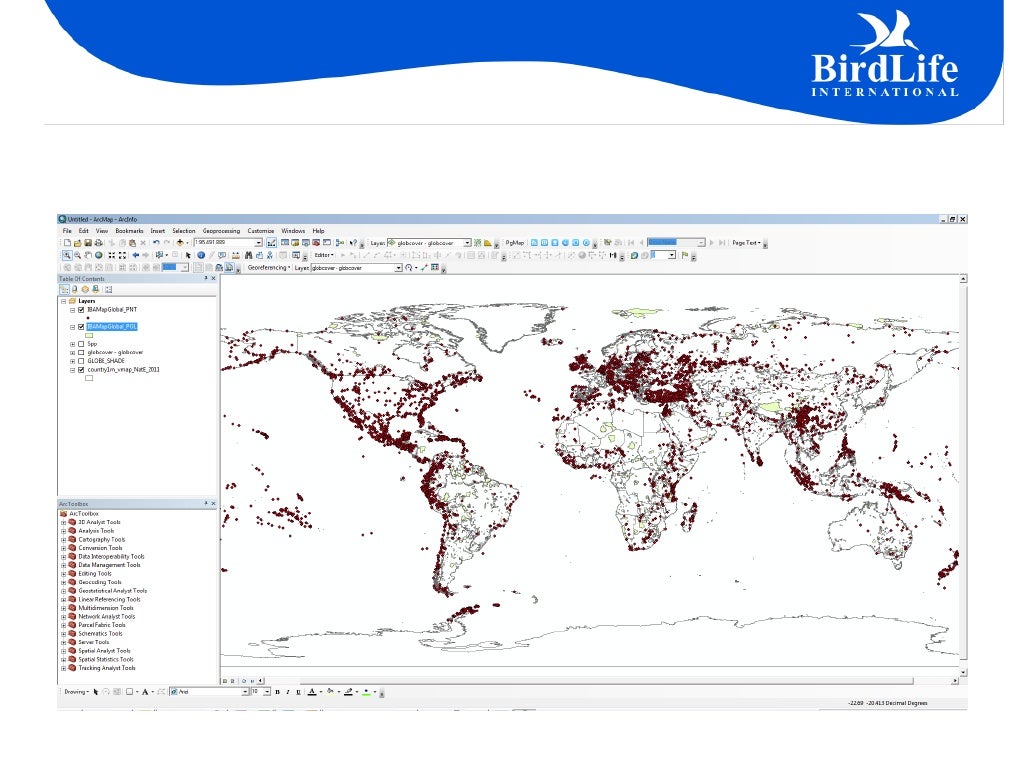
- Did you check for records miles from plausible habitats? In one 2020 project, we found penguin records in Central Africa due to a swapped latitude/longitude column!
Counterintuitive tip: Always open every file in a spreadsheet before touching GIS—catch weirdness fast.
3. Troubleshooting Data Headaches: From Nonsense Maps to Vanishing Points
If something’s off visually, start here:
Scenario A — All Points Missing or Clustered Off-Map
- Confirm the CRS (Coordinate Reference System) matches across layers.
- In QGIS: Right-click layer > Properties > Source > CRS.
- If points cluster at [0°,0°] (“Null Island”), check for empty coordinate fields.
- If importing CSVs with text headers (“Lat”/“Long”), make sure columns are NUMBER not TEXT.
- Run a quick bounding box filter—is your study area where you think it should be?
- In ArcGIS/QGIS attribute table—sort by latitude/longitude ascending/descending; look for outliers (>1000 or < -1000 usually means trouble).
Scenario B — Layers Stack But Don’t Line Up
- Reproject everything explicitly—not just visually aligning! Use QGIS ‘Reproject Layer’ tool.
- Watch out for mismatched datums (WGS84 vs NAD83).
- Test by adding an authoritative basemap (OSM or Esri World Imagery); if nothing fits, start reprocessing from raw files.
Scenario C — Records Missing After Join/Merge
- Possible cause: Mismatched ID fields (
Spec_IDvsspecid). Standardize naming, type (INTEGER vs TEXT), and casing. - Try merging smaller batches first; note precisely which rows vanish.
Pro move: Build a “data audit notebook”—log every transform step-by-step so oddities can be traced without guesswork months later.
4. Workflow Woes: Diagnosing Analysis Failures and Software Meltdowns
Sometimes everything looks fine until analysis starts…
Scenario D — Buffers/Overlays Don’t Return Expected Results
Failed first attempt: I once buffered river lines by kilometers instead of meters; entire provinces vanished.
Checklist:
- Consistently use SI units; doublecheck buffer distances.
- For overlays (“select within X km”), make sure geometry types match (point-in-polygon vs polygon-in-polygon).
- When nothing gets selected—test on a single known point/polygon as proof-of-concept before scaling up.
Scenario E — Analyses Hang Indefinitely or Crash
Sensory detail: Your CPU fan spins up like a jet engine but progress bar stays stuck at 10%.
Quick rescue:
- Clip all rasters/vectors tightly around area-of-interest before running any heavy spatial analysis.
- Save intermediate steps as new layers—never re-run full chains unless necessary.
- Use built-in statistics tools (
r.reportin GRASS or “Basic Stats” in QGIS) to check input sizes before launching big jobs.
Scenario F — Outputs Make No Ecological Sense
Dialogue with biologist colleague:
“Why do our amphibian models show high suitability over city centers?”
“Oh…I forgot to mask urban areas from landcover predictors.”
Always cross-check final maps against known reality—a simple Google Satellite overlay goes a long way toward catching embarrassments early!
5. Making Sense of Models Gone Wrong (Because They Will—Trust Me)
Habitat suitability models like MaxEnt can go sideways fast:
Classic Signs:
- Suitability scores maxed out everywhere—or nowhere at all.
- Output values look random compared to input occurrence points.
Root Causes & Fixes:
| Symptom | Likely Cause | Fastest Fix |
|---|---|---|
| Overfit predictions | Too many predictors | Run variable correlation matrix; drop highly-correlated variables |
| Unrealistic range extension | Spatial bias in records | Spatially thin points beforehand |
| Poor model metrics | Overlapping train/test sets | Partition geographically or temporally |
Personal hack: Always run baseline models with only two predictors before scaling complexity up—a lesson learned after wasting days debugging multivariate spaghetti!
If you’re interested in how these models can be made more robust by incorporating changes in habitat over time, check out Using GIS to Monitor Habitat Changes and Their Impact on Biodiversity.
6. Visualization Nightmares & Communication Hurdles
An ugly map is worse than no map—it kills stakeholder trust instantly.
Common Mistakes:
- Color scales that hide small differences (‘rainbow’ palettes = bad news).
- Cluttered maps with >5 overlapping layers…nobody knows what’s what anymore!
- Legends missing units/descriptions (“Hotspot intensity = ???”).
Rescue Plan:
- Limit each visualization to ONE key question (“Where is richness highest?” not “Everything everywhere all at once”).
- Test maps with non-expert friends—they’ll spot confusion immediately!
A trick from teaching workshops: Grayscale base layers usually help colorful overlays stand out better than flashy satellite imagery backgrounds.
For strategies on making your biodiversity hotspot maps clear and actionable, see The Role of GIS in Identifying Biodiversity Hotspots for Conservation.
7. Integrating Crowdsourced Data Without Losing Your Mind
Citizen science rocks—but variable quality can torpedo analyses:
What Goes Wrong:
- Duplicate reports across platforms (eBird/iNaturalist overlap).
- Misidentified or mislocated species reports ("Bear" reported from suburban London).
- Inconsistent temporal density (bursts during BioBlitz events).
Real Fixes:
- Implement automated de-duping scripts (
unique()filters in R/QGIS Field Calculator). - Download only expert-confirmed submissions where possible (“Research Grade” on iNaturalist).
- Normalize effort using effort-corrected kernels rather than raw densities if analyzing patterns over time/space.
In my own workflow circa early 2022, combining eBird + GBIF led initially to triple-counts until I scripted matching algorithms based on exact date/time/species/location combos—a painstaking but essential investment!
8. Future-Proofing: Common Pitfalls in Ongoing Projects
Even successful projects hit turbulence down the road:
Problems That Sneak Up Later
- New versions of QGIS/ArcGIS break old workflows/scripts
- Remote sensing data sources change access policies/APIs expire
- Project team expands but onboarding new analysts is chaos
Proactive Moves:
- Archive copies of every versioned script AND raw/intermediate datasets right after each major milestone.
- Use open formats (.csv/.tif/.shp) wherever possible so future tools can re-ingest legacy data without drama.
A mistake I made: Not saving Landsat download scripts meant I couldn’t reproduce analyses when the USGS portal changed login requirements overnight in mid-2021! Lesson learned forever.
If you want to strengthen your approach by integrating satellite imagery and other remote data sources, Integrating Remote Sensing Data with GIS for Biodiversity Analysis is a must-read.
9. Rapid Rescue Kit: Tools and Tricks for Crises Big or Small
Over years of trial-and-error—and helping dozens of teams bail themselves out at crunch time—these have become my go-tos:
Top Three All-Purpose Fixes
1. OGRINFO/GDAL CLI tools
Before opening gigantic files that might crash desktop GIS—run command-line stats/checks (ogrinfo, gdalinfo) for basic sanity checks.
2. QGIS Processing Toolbox
Batch process hundreds/thousands of files via plugins (“Batch Reproject”, “Concatenate Layers”, etc.). If GUI hangs,
restart process as script.
3. DataCleaner plugin + OpenRefine
For heavy-duty attribute cleaning/removal of non-standard characters/missing values prior to import.
And always keep an external hard drive handy—for quick backups when things smell wrong!
10. Real World War Stories—from Total Flops To Eureka Moments
No pillar guide would be honest without sharing facepalms as well as breakthroughs:
Amazon Connectivity Mapping Disaster
Attempt #1 tried least-cost path analysis on unprocessed SRTM elevation tiles covering half a continent—it crashed every time.
Lesson learned? Always subset rasters first (~500MB chunks). End result? Once clipped correctly, finished analysis overnight instead of three weeks!
Madagascar Amphibian Surprise
Initial MaxEnt models predicted suitable habitat far outside known ranges…but after filtering erroneous occurrence records logged at major airports (!), results matched field expert intuition perfectly.
Pollinator Hotspot Map Victory
After three rounds of failed thematic mapping attempts swamped by background clutter,
switching base layer from satellite imagery to plain white finally let key activity clusters pop—turning skepticism into policy change overnight.
11. Your Next Steps: Bulletproofing Your Own Workflow
Here’s a distilled action plan anyone—including skeptical managers or brand-new students—can implement immediately:
A) Write down exactly what ecological question you want answered—not “map everything.”
B) Gather ALL meta-data about origin/provenance/sampling methods BEFORE import—not after seeing weird outputs!
C) Document transformations/refinements religiously—from initial download all the way through final figure generation.
And above all…
Don’t treat errors as shameful detours—they’re clues pointing toward breakthroughs hidden inside your data!
Final Words From Experience…
If there’s only one thing decades working across conservation NGOs/universities/governments taught me about GIS+biodiversity:
it isn’t about having perfect workflows—but building troubleshooting muscles strong enough that no crisis ever stops progress cold again.
Maps lie until we force them to tell deeper truths through relentless curiosity…and smart recovery tactics.
Bookmark this guide; return whenever stuck—or use it as ammo next time someone says “just press run.” Because mastery isn’t about avoiding failure—it’s learning how quickly you recover…and turn setbacks into insights nobody else sees coming.
You’re now equipped not just with best practices—but real-world wisdom earned through hard-won troubleshooting victories!
Ready when you are—the next discovery is waiting right behind your latest error message!


